> ## Documentation Index
> Fetch the complete documentation index at: https://docs.occtoo.com/llms.txt
> Use this file to discover all available pages before exploring further.
# CDN usage
> Daily hits and bandwidth across every destination, with a table view and a CSV export.
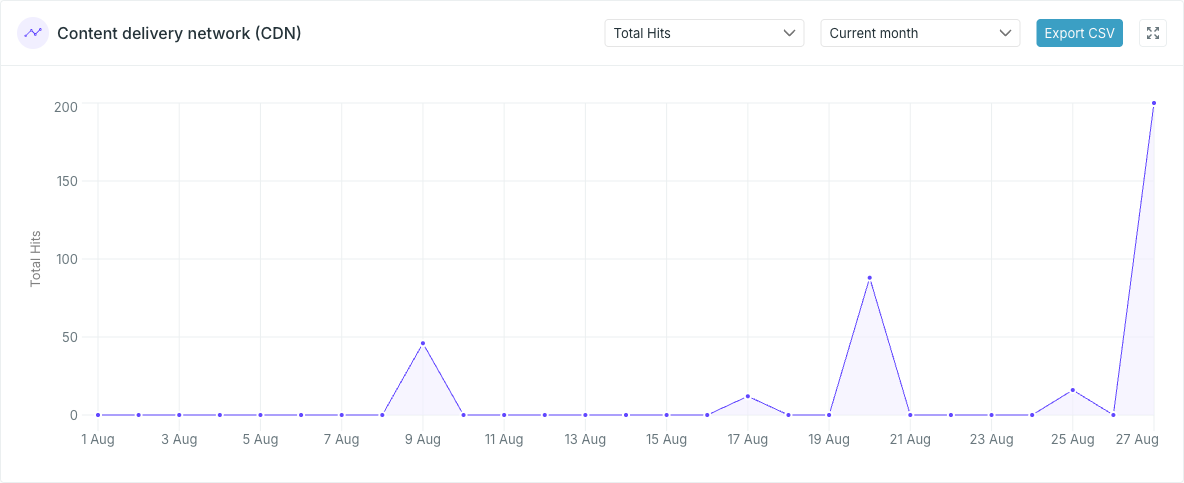
The **Content delivery network (CDN)** board plots what your destinations served, one point per day, across all destinations in the environment.
 ## Choose what to plot
The first selector picks the measure:
| Option | What it plots |
| ------------------ | ------------------------------------------------------------------ |
| **Total Hits** | Number of requests served |
| **Megabytes (MB)** | Volume served, converted from bytes and rounded to whole megabytes |
| **MB / hits** | Average size of a response, to three decimals |
The second picks the period: **Last 7 days**, **Current month**, **Last month** or **Last 3 months**.
Days with no traffic are plotted as zero rather than skipped, so the horizontal axis always covers the whole period. On the **MB / hits** measure a day with no hits is also zero — it is not an average of nothing.
## See the numbers behind the chart
The expand icon in the board header opens a full-screen view: the same chart, with a table of every day underneath.
## Choose what to plot
The first selector picks the measure:
| Option | What it plots |
| ------------------ | ------------------------------------------------------------------ |
| **Total Hits** | Number of requests served |
| **Megabytes (MB)** | Volume served, converted from bytes and rounded to whole megabytes |
| **MB / hits** | Average size of a response, to three decimals |
The second picks the period: **Last 7 days**, **Current month**, **Last month** or **Last 3 months**.
Days with no traffic are plotted as zero rather than skipped, so the horizontal axis always covers the whole period. On the **MB / hits** measure a day with no hits is also zero — it is not an average of nothing.
## See the numbers behind the chart
The expand icon in the board header opens a full-screen view: the same chart, with a table of every day underneath.
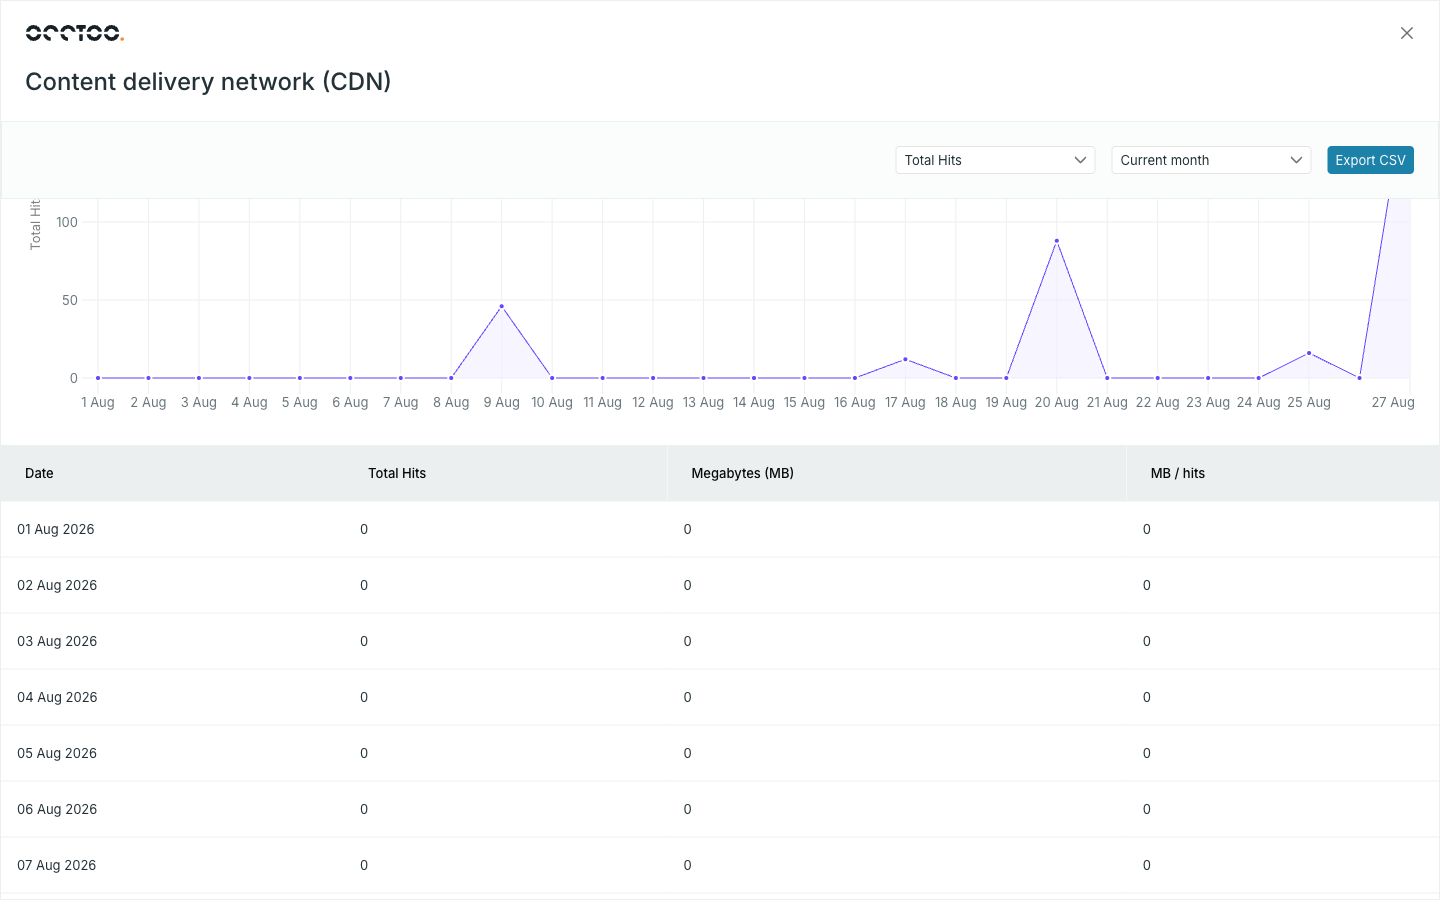 The table shows all three measures at once — **Date**, **Total Hits**, **Megabytes (MB)** and **MB / hits** — regardless of which one the chart is plotting. Every column header sorts. The selectors and **Export CSV** stay available at the top of the full-screen view.
Close it with the **X** or the Escape key.
## Export to CSV
**Export CSV** downloads the currently selected period as `CDN-Stats-.csv`, stamped with today's date.
The file is **semicolon-delimited** and splits the date into two numeric columns:
```
Month;Day;Total Hits;Megabytes (MB);MB / hits
8;27;200;29;0.144
```
The export follows the period selector but ignores the measure selector — every export contains all three measures. It carries no year column, so exports spanning a year boundary need the file name to tell them apart.
The table shows all three measures at once — **Date**, **Total Hits**, **Megabytes (MB)** and **MB / hits** — regardless of which one the chart is plotting. Every column header sorts. The selectors and **Export CSV** stay available at the top of the full-screen view.
Close it with the **X** or the Escape key.
## Export to CSV
**Export CSV** downloads the currently selected period as `CDN-Stats-.csv`, stamped with today's date.
The file is **semicolon-delimited** and splits the date into two numeric columns:
```
Month;Day;Total Hits;Megabytes (MB);MB / hits
8;27;200;29;0.144
```
The export follows the period selector but ignores the measure selector — every export contains all three measures. It carries no year column, so exports spanning a year boundary need the file name to tell them apart.