> ## Documentation Index
> Fetch the complete documentation index at: https://docs.occtoo.com/llms.txt
> Use this file to discover all available pages before exploring further.
# The Dashboard
> The landing page of Occtoo Studio: how much you have built, what you use most, and where your data is being consumed.
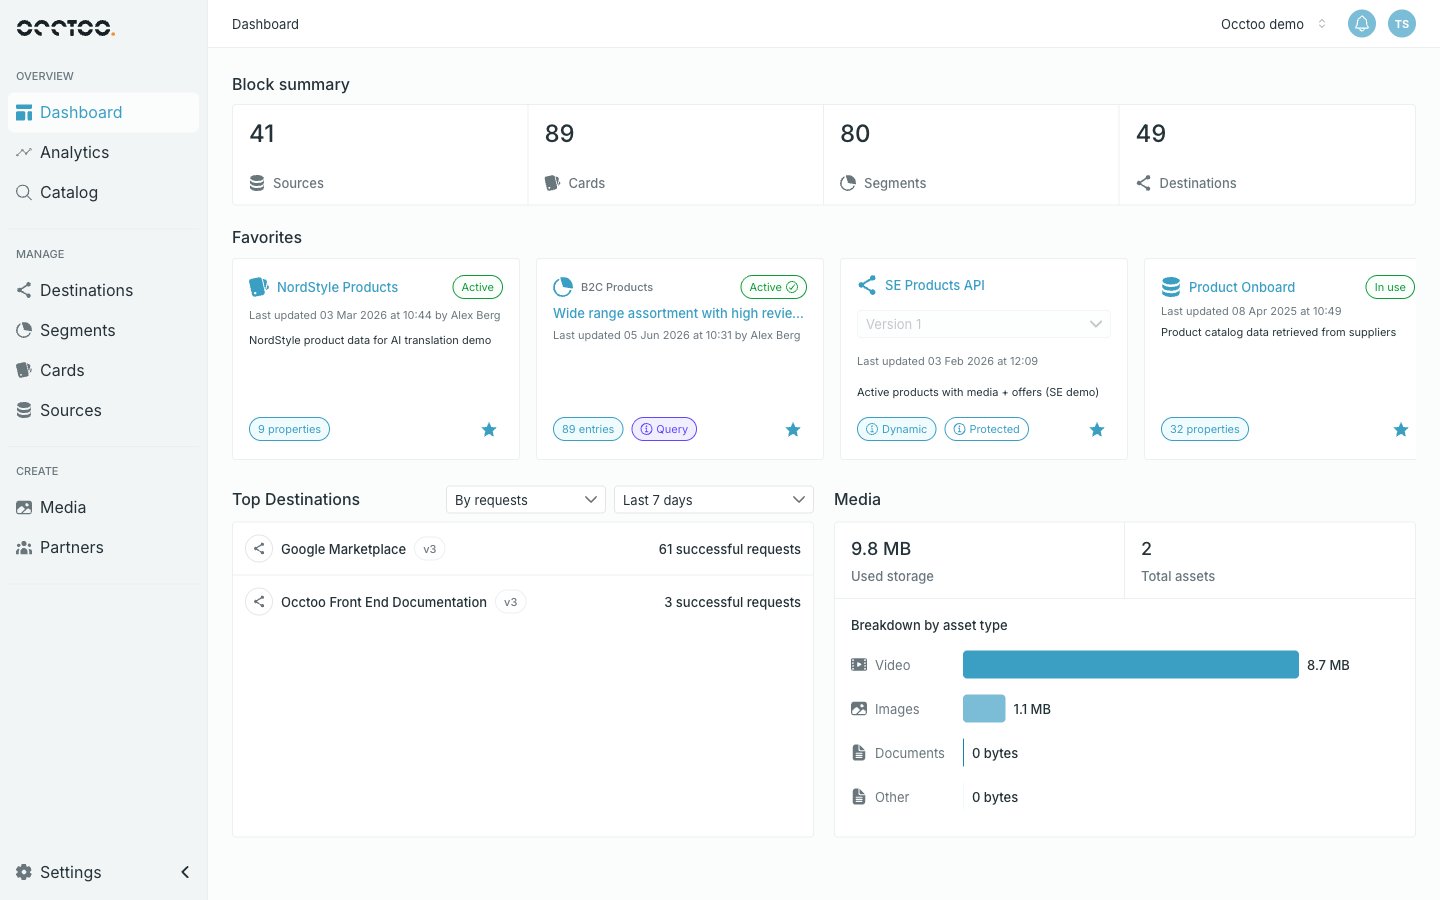
The **Dashboard** is the page you land on after signing in, and the first item in the left navigation. It summarises the tenant you are currently working in — how many blocks exist, which of them you have starred, which destinations are being called, and how much media you store.
 ## Block summary
Four counters, one per block type: **Sources**, **Cards**, **Segments** and **Destinations**. Each counter is a link — click it to open that section.
The numbers are totals for the environment, not filtered counts. A destination is counted once regardless of how many API versions it has.
## Favorites
A horizontal strip of the blocks you have starred, mixing all four block types. See [Favorites](/guides/studio/dashboard/favorites).
## Top Destinations
The destinations receiving the most traffic, at most ten of them.
## Block summary
Four counters, one per block type: **Sources**, **Cards**, **Segments** and **Destinations**. Each counter is a link — click it to open that section.
The numbers are totals for the environment, not filtered counts. A destination is counted once regardless of how many API versions it has.
## Favorites
A horizontal strip of the blocks you have starred, mixing all four block types. See [Favorites](/guides/studio/dashboard/favorites).
## Top Destinations
The destinations receiving the most traffic, at most ten of them.
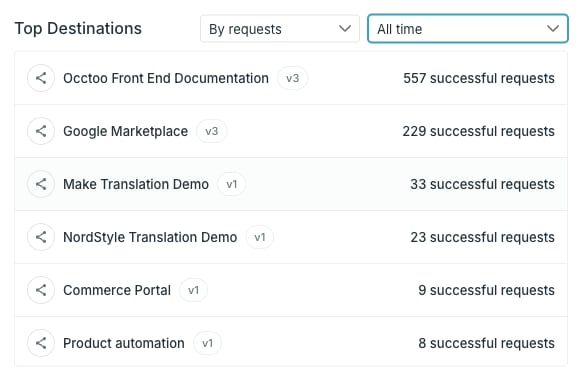 Two selectors control the list:
| Selector | Options |
| -------- | ---------------------------------------------------------- |
| Metric | **By requests**, **By bandwidth** |
| Period | **Today**, **Last 7 days**, **Last 30 days**, **All time** |
Each row names the destination, badges the API version it counts, and shows the figure for the selected metric. Clicking a row opens that version.
Only **successful** requests are counted — calls that returned HTTP 200. Failed and rejected calls never appear here, so a destination that is being called incorrectly can look idle. Use the destination's own **Analytics** tab to see the full picture.
Versions that have been deleted are dropped from the list even if they generated traffic during the period.
## Media
Storage and asset counts for the environment.
Two selectors control the list:
| Selector | Options |
| -------- | ---------------------------------------------------------- |
| Metric | **By requests**, **By bandwidth** |
| Period | **Today**, **Last 7 days**, **Last 30 days**, **All time** |
Each row names the destination, badges the API version it counts, and shows the figure for the selected metric. Clicking a row opens that version.
Only **successful** requests are counted — calls that returned HTTP 200. Failed and rejected calls never appear here, so a destination that is being called incorrectly can look idle. Use the destination's own **Analytics** tab to see the full picture.
Versions that have been deleted are dropped from the list even if they generated traffic during the period.
## Media
Storage and asset counts for the environment.
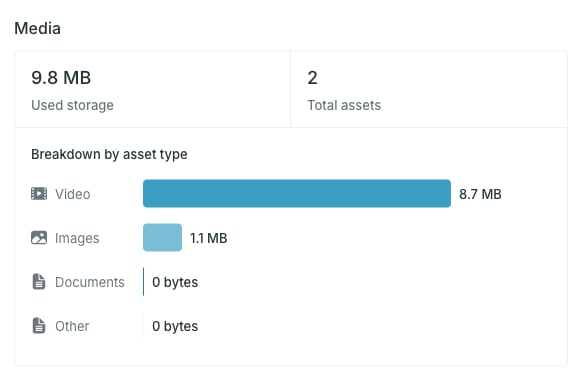 The two figures at the top are **Used storage** (the sum of all file sizes) and **Total assets** (the number of files). Below them, **Breakdown by asset type** splits that storage into four groups:
| Group | What lands in it |
| --------- | -------------------------------------------------- |
| Images | Any `image/*` file |
| Video | Any `video/*` file |
| Documents | PDF, Word, Excel, plain text, CSV, XML, JSON, HTML |
| Other | Everything else |
Groups are ordered largest first, and the bar lengths are relative to the largest group — not to your total quota.
## Who can do what
Everyone can see the Dashboard, and every role can star and unstar blocks. The widgets show whatever the environment holds; they are not filtered by role. What differs is what you can do once you click through to a source, card, segment or destination.
See [Users and roles](/guides/studio/settings/users-and-roles) for the full picture.
The two figures at the top are **Used storage** (the sum of all file sizes) and **Total assets** (the number of files). Below them, **Breakdown by asset type** splits that storage into four groups:
| Group | What lands in it |
| --------- | -------------------------------------------------- |
| Images | Any `image/*` file |
| Video | Any `video/*` file |
| Documents | PDF, Word, Excel, plain text, CSV, XML, JSON, HTML |
| Other | Everything else |
Groups are ordered largest first, and the bar lengths are relative to the largest group — not to your total quota.
## Who can do what
Everyone can see the Dashboard, and every role can star and unstar blocks. The widgets show whatever the environment holds; they are not filtered by role. What differs is what you can do once you click through to a source, card, segment or destination.
See [Users and roles](/guides/studio/settings/users-and-roles) for the full picture.