> ## Documentation Index
> Fetch the complete documentation index at: https://docs.occtoo.com/llms.txt
> Use this file to discover all available pages before exploring further.
# Monitor onboarding
> Read ingest volume, effectiveness and rate over time, and check language coverage.
Two widgets on the source page show how onboarding is going: **Updates over time** and **Languages**.
## Updates over time
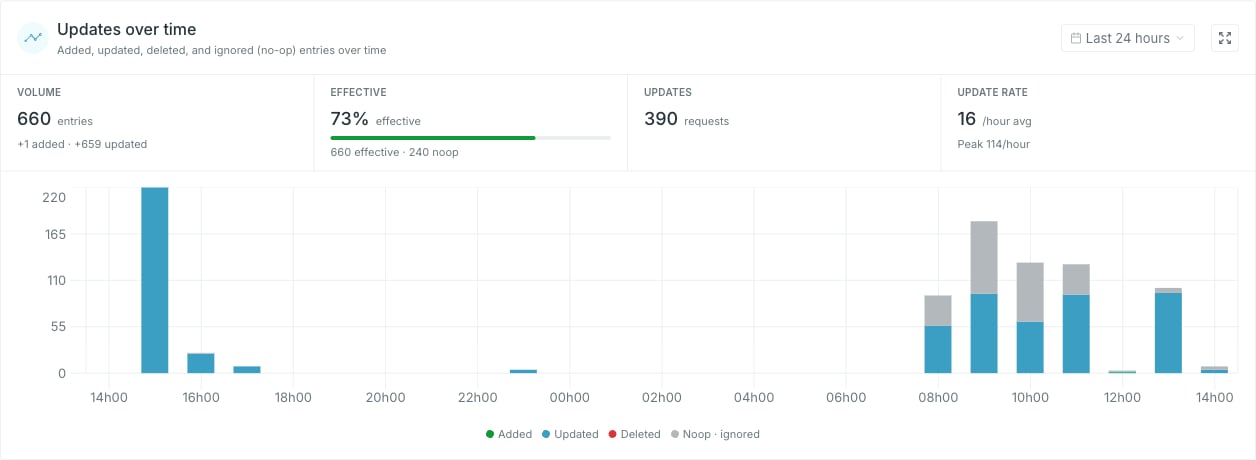 The chart breaks the chosen time frame into added, updated, deleted and ignored entries. A source with no ingest activity in range shows **No updates available** instead — widen the range, or check the freshness badge in the page header.
### The four stat boxes
| Box | What it counts |
| --------------- | ---------------------------------------------------------------- |
| **Volume** | Added + updated + deleted entries, with the breakdown underneath |
| **Effective** | The share of processed entries that actually changed something |
| **Updates** | The number of ingest requests in the range |
| **Update rate** | Average requests per bucket, with the busiest bucket as **Peak** |
### Effectiveness
An ingest call that sends a value identical to the stored one is a **noop** — counted, but no change. **Effective** is everything that did change, over everything processed.
A low effectiveness percentage means the integration is resending unchanged data. That is harmless for correctness but wasteful, and it is the main thing this box is for.
### Rate units
The rate adapts to the window. Over a short window it is reported per minute, over longer ones per hour or per day, so the number stays meaningful rather than always being an hourly average.
### Time frame
The chart breaks the chosen time frame into added, updated, deleted and ignored entries. A source with no ingest activity in range shows **No updates available** instead — widen the range, or check the freshness badge in the page header.
### The four stat boxes
| Box | What it counts |
| --------------- | ---------------------------------------------------------------- |
| **Volume** | Added + updated + deleted entries, with the breakdown underneath |
| **Effective** | The share of processed entries that actually changed something |
| **Updates** | The number of ingest requests in the range |
| **Update rate** | Average requests per bucket, with the busiest bucket as **Peak** |
### Effectiveness
An ingest call that sends a value identical to the stored one is a **noop** — counted, but no change. **Effective** is everything that did change, over everything processed.
A low effectiveness percentage means the integration is resending unchanged data. That is harmless for correctness but wasteful, and it is the main thing this box is for.
### Rate units
The rate adapts to the window. Over a short window it is reported per minute, over longer ones per hour or per day, so the number stays meaningful rather than always being an hourly average.
### Time frame
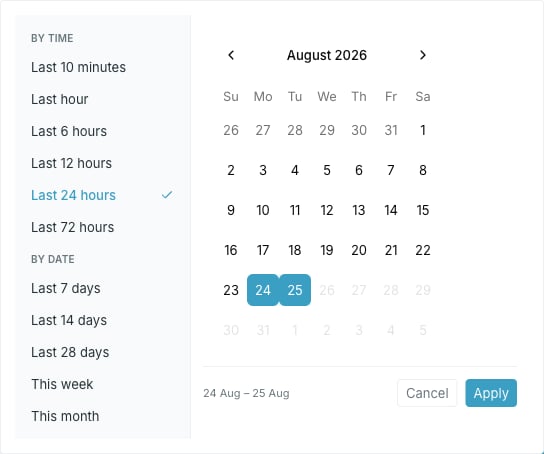 **By time** offers ranges from the last 10 minutes up to the last 72 hours. **By date** offers the last 7, 14 or 28 days, this week and this month. The default is **Last 24 hours**. You can also pick a custom range on the calendar.
**Last 10 minutes** is a live view: it re-reads the data every minute and keeps the window rolling, so you can watch an ingest run as it happens.
## Languages
The **Languages** widget shows localized value coverage per language, and carries the language count in its heading.
**By time** offers ranges from the last 10 minutes up to the last 72 hours. **By date** offers the last 7, 14 or 28 days, this week and this month. The default is **Last 24 hours**. You can also pick a custom range on the calendar.
**Last 10 minutes** is a live view: it re-reads the data every minute and keeps the window rolling, so you can watch an ingest run as it happens.
## Languages
The **Languages** widget shows localized value coverage per language, and carries the language count in its heading.
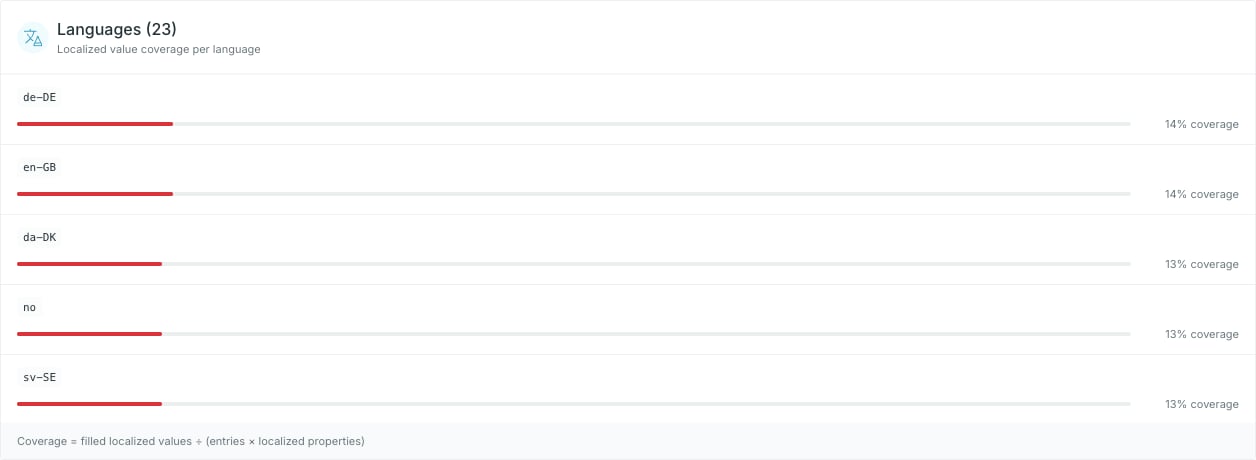 Each row is a language code with its coverage bar and percentage, sorted highest first. Coverage is filled localized values divided by entries × localized properties.
### Three empty states
* **No localized properties** — coverage only means something once the source has **Localized text** or **Localized list** properties.
* **No entries yet** — localized properties exist, but there is nothing to measure them against.
* **No languages detected** — no localized values have been ingested yet.
Languages are discovered from the data, not configured. A language appears as soon as a localized value arrives for it.
Each row is a language code with its coverage bar and percentage, sorted highest first. Coverage is filled localized values divided by entries × localized properties.
### Three empty states
* **No localized properties** — coverage only means something once the source has **Localized text** or **Localized list** properties.
* **No entries yet** — localized properties exist, but there is nothing to measure them against.
* **No languages detected** — no localized values have been ingested yet.
Languages are discovered from the data, not configured. A language appears as soon as a localized value arrives for it.