

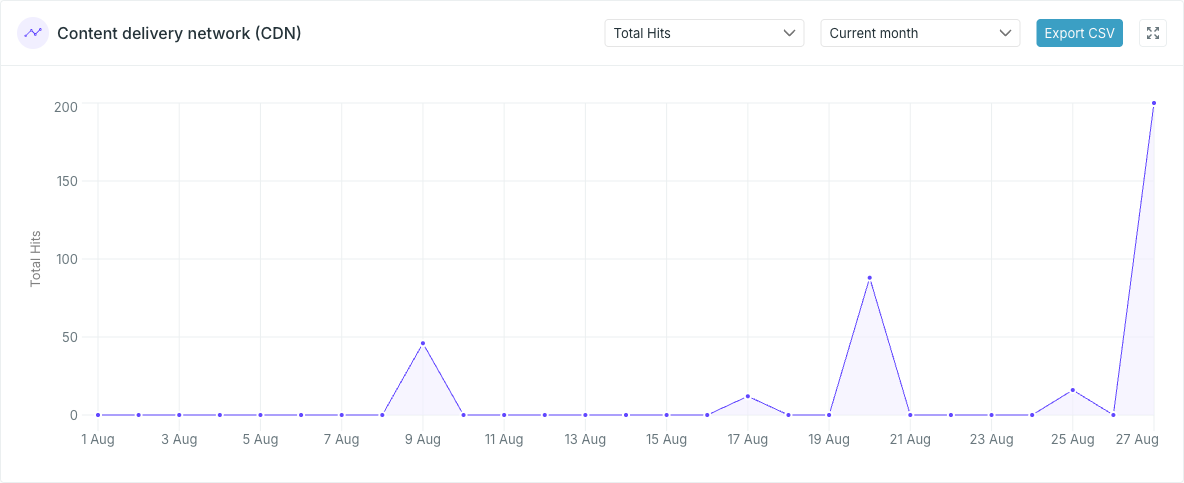
Choose what to plot
The first selector picks the measure:
The second picks the period: Last 7 days, Current month, Last month or Last 3 months.
Days with no traffic are plotted as zero rather than skipped, so the horizontal axis always covers the whole period. On the MB / hits measure a day with no hits is also zero — it is not an average of nothing.
See the numbers behind the chart
The expand icon in the board header opens a full-screen view: the same chart, with a table of every day underneath.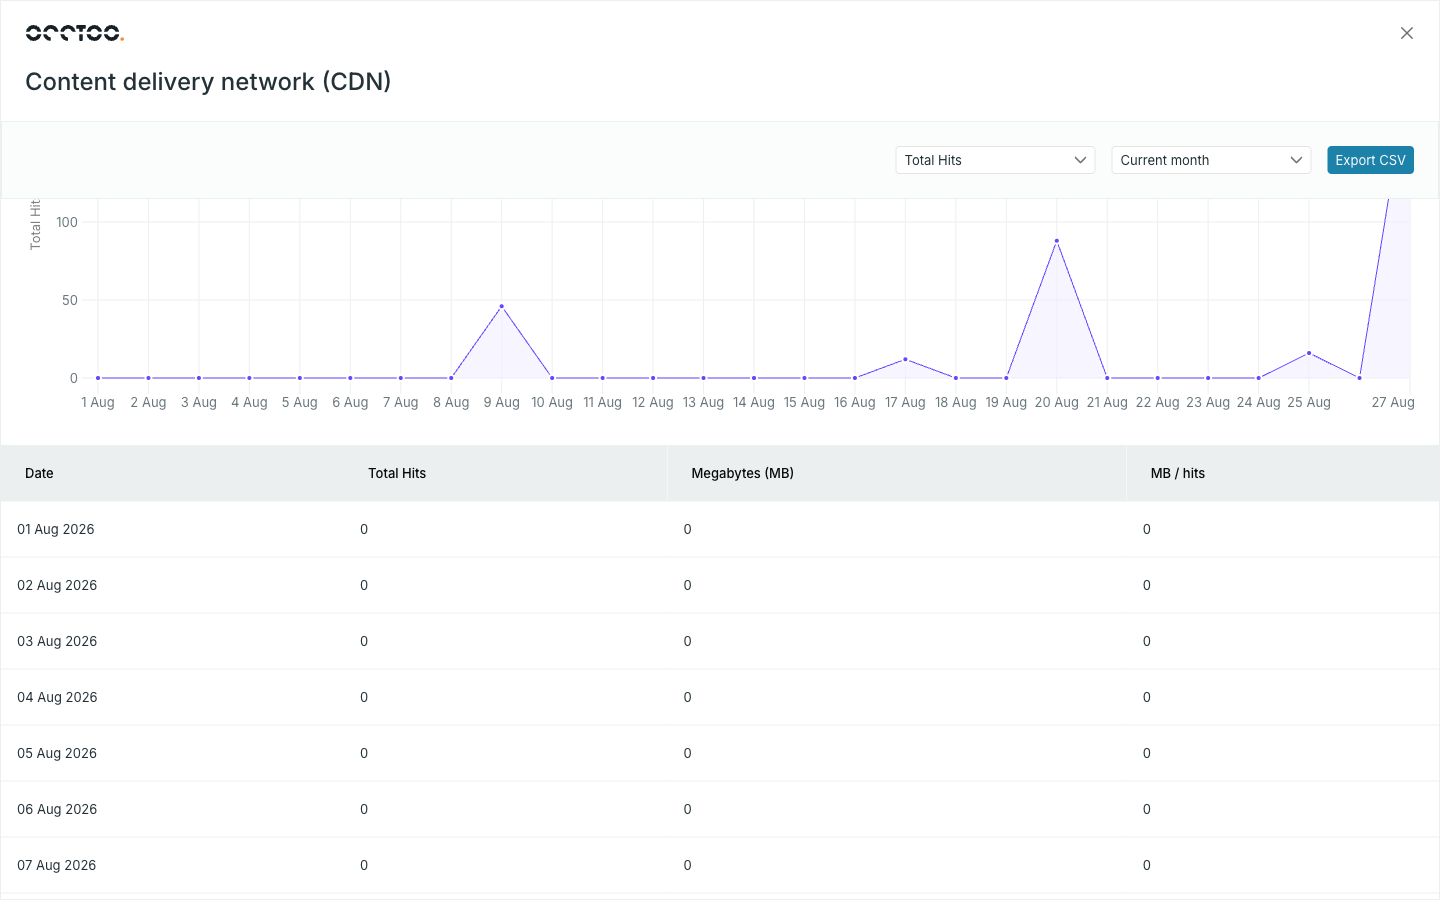
Export to CSV
Export CSV downloads the currently selected period asCDN-Stats-<YYYY-MM-DD>.csv, stamped with today’s date.
The file is semicolon-delimited and splits the date into two numeric columns: